MonashVegMap
A 10 m land-cover map of Victoria, Australia
What is this map and where can I see it?
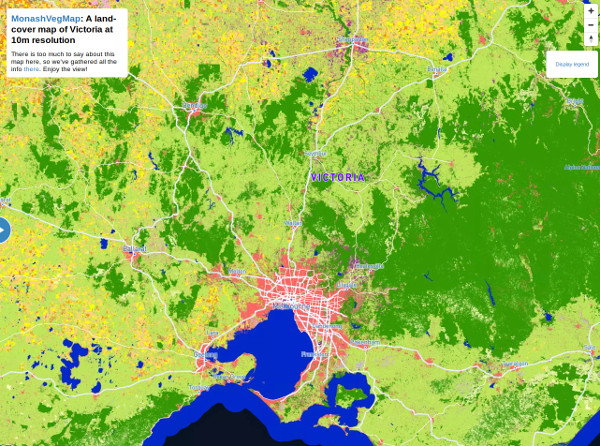
This map is a land-cover/land-use map of the State of Victoria in Australia at 10 m spatial resolution. It is the very first map of its kind in Victoria and was created for the period ranging from winter 2017 to winter 2018.
In the map, each 'pixel' (representing an area of 10 m by 10 m) is assigned a colour . For example, pink is for an urban area, blue is for water, pale green is for grassland, pale orange is for cereal crops, etc. The full legend is given at the top right of the map.
To enjoy the view of the map in a full page, please click here or on the map on the right
Who created this map?
This map was created by our research team in machine learning and remote sensing, which is led by Dr François Petitjean (Monash) and Prof Geoff Webb (Monash). This map could not have been created without the leadership of our postdoctoral fellow Dr Charlotte Pelletier (Monash), the help of Dr Kathryn Sheffield (Agriculture Victoria), Dr Elizabeth Morse-McNabb (Agriculture Victoria) and Olivier Hagolle (CESBIO), as well as the software development of our research assistant Zehui Ji.


Download and licence
This map is licensed under a Creative Commons Attribution-NonCommercial-NoDerivatives 4.0 International License.
We are open to providing other types of licences (including free) depending on the use you want to have of our map - please contact François
You can either view the map or download a full-resolution GeoTiff image at 10 m. To download, it, please enter your email below and a download link will be emailed to you right away.
How was it created?
This map is the result of our in-house machine learning algorithm, trained using campaign reference data from the VLUIS project on one year of Sentinel-2 data over the State of Victoria. We detail below how we did it.
Satellite data and preprocessing
We used 1 year of Sentinel-2 L2A images spanning the period July 15 2017 August 14 2018. L2A images provide surface reflectance after atmospheric correction, as well as a good cloud mask. The Sentinel-2 data was downloaded from the PEPS servers, which provide Sentinel-2 data at Level-2A, processed on-demand from Level-1C with CNES/CESBIO's MAJA processor. We built on the PEPS download scripts to download 4,349 images across the 37 tiles (100 km 100 km) that intersect the state of Victoria.
The data is then preprocessed following almost religiously the amazing processing chain developed at the CESBIO lab and summarised in their paper (Section 4.3). In essence, for each 100 km 100 km title, we:
- Unzip all images
- Create a binary cloud mask for each date using CLM, EDG and SAT channels
- Resample all 20m bands to 10 m
- Create a big stack of all images for a tile (across the whole year of observation)
- Create a big stack of all cloud masks
- Gapfill and resample all images to a fixed 5-day grid. That step makes it possible to remove cloud-covered information but also ensures that all (x,y) areas in the whole State of Victoria are described by the same number of timestamps.
Reference data
We used the reference data collected by the VLUIS group, mainly during a field campaign over the period October-December 2017, with a few polygons collected by photo-interpretation. They provided us with 7,172 polygons, each of size 250 m 250 m. More information about the VLUIS project and map here. In addition, because the data didn't include any non-photosynthetic example such as for urban areas, we collected another 524 polygons (of the same size) by photo-interpretation.
Machine learning model
We trained our state-of-the-art TempCNN model, which is a deep learning model that can effectively analyse the evolution of reflectance values using temporal convolution filters. The source code is available here .
Acknowledgements
A lot of work has gone into this map, and it would have been impossible without the concomitance of available ground campaign data, existing software and supporting people and infrastructure. We would like to thank:
- The Australian Research Council, which is funding François' DECRA fellowship on Machine Learning for Earth Observation.
- The VLUIS group at Agriculture Victoria for making their reference data available and supporting us throughout this project: Dr Elizabeth Morse-McNabb, Dr Kathryn Sheffield, Rob Clark, Hayden Lewis, and Susan Robson.
- The PEPS team for their help processing and downloading such a large quantity of data, and in particular Dr Christophe Taillan and Erwann Poupart.
- The CESBIO lab for their contribution to the OTB software via the development of the Iota-2: Dr Jordi Inglada, Arthur Vincent, Dr Vincent Thierion, Marcela Arias and Benjamin Tardy, as well as Olivier Hagolle for developing MAJA.
- The Copernicus programme, which funds the Sentinel-2 mission and satellites.
- Monash Faculty of Information Technology for supporting this work via Zehui's summer scholarship.
- Mapbox, which is the software we use to provide you with a view of the map, and who's community team granted us with free service.
Quality, limitations and disclaimers
There are things that we would have liked to do better, but at some point we needed to draw a line and release our map. We list the known issues and limitations below.
- Doing a blocked cross-validation on the reference data, our map has an accuracy of 94% (ie approximately 19 pixels out of 20 are correctly classified).
- The reference data uses mostly pure 250 m 250 m polygons. This is because the ground campaing data was targeted for the VLUIS project, which uses MODIS data at the same resolution. Although this doesn't change the fact that our map is trully at 10 m resolution, better results could have been obtained with larger and more diverse examples. (Like any ground campaign, examples are not collected at random and follow roads and generally areas that are accessible by car.)
- The quantity of reference data is relatively low with 7,696 polygons, which translates to 3.7 million examples at 10 m resolution, for approximately 2.3 billion surface areas (10 m 10 m) in Victoria.
- The two last observations above have led to results that are suboptimal particularly in the Mallee (an area in the north-west of Victoria).
- The urban and non-photosynthetic class regroups many types of soil, including sand or areas with very little vegetation, such as in the Big and Little deserts.
- Data preprocessing (eg cloud misdetection, sensor issues) can, in places, have had a significant influence on the results by providing only a few clear observations for a few areas. We have for example observed that to be the case over Wilsons Promontory.
- The period of study (July 2017 August 2018) is slightly misaligned with the agricultural season in Victoria where winter crops start growing in June. This can have some impact, in particular among bare soil and grassland classes.
- The preview of the map (accessible via clicking on the map at the top ) has been simplified by Mapbox after upload. This is why you might see some blured areas when zooming to full resolution. To access the 10 m product, please use the GeoTiff (accessible via the Downloads section).
Disclaimer: The map is the result of a scientific project and with no guarantee of accuracy. The material provided on this site, including the map, does not constitute the provision of professional advice. Monash University does not warrant or guarantee, and accepts no legal liability whatsoever arising from or connected to, the accuracy, reliability, currency or completeness of any material contained on this website. Users should seek independent professional advice.
Referencing this map and getting in touch.
We would love to hear what you think of this map, so please email us or simply send us a tweet .
To reference the work, please cite:
Charlotte Pelletier, Geoffrey I. Webb and Francois Petitjean, Temporal Convolutional Neural Network for the Classification of Satellite Image Time Series, Remote Sensing, Vol. 11, Num. 5, 2019. https://doi.org/10.3390/rs11050523
Charlotte Pelletier, Zehui Ji, Olivier Hagolle, Elizabeth Morse-McNabb, Kathryn Sheffield, Geoffrey I. Webb and Francois Petitjean, Using Sentinel-2 Image Time Series to map the State of Victoria, Australia, MultiTemp, 2019.